
Third Quarter 2018 Highlights
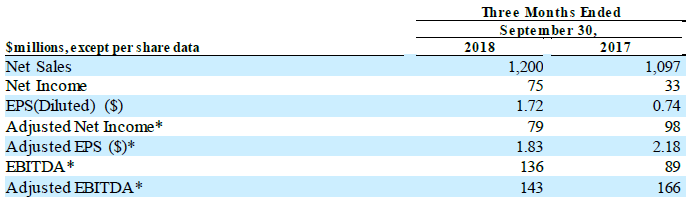
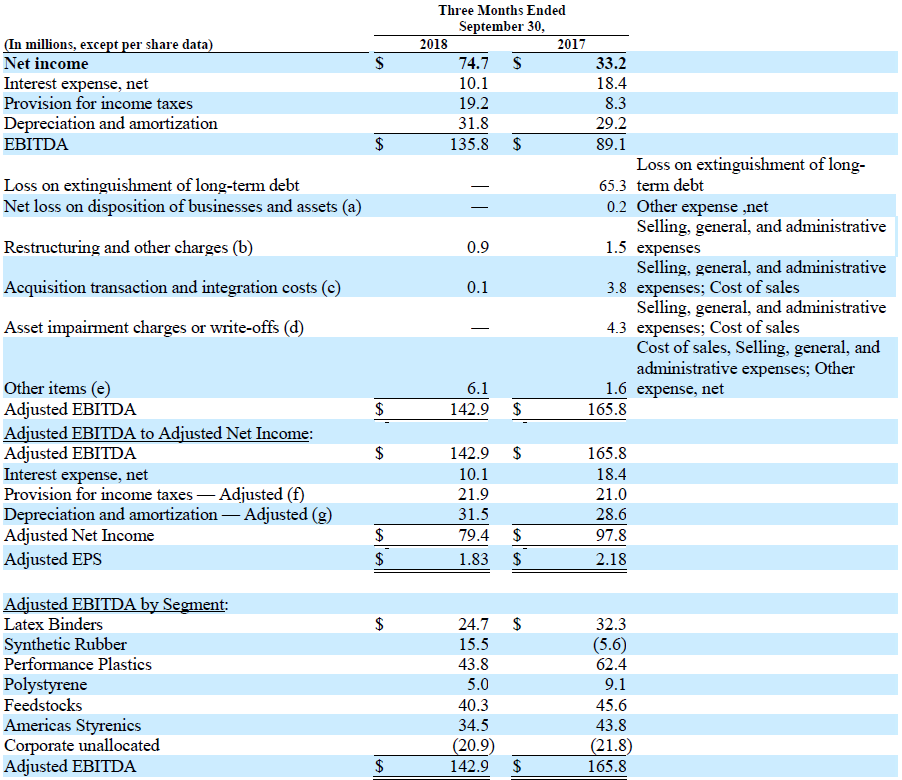
*For a reconciliation of EBITDA, Adjusted EBITDA, and Adjusted Net Income to Net Income, as well as a reconciliation of Adjusted EPS, see note 2 below.
Trinseo (NYSE: TSE), a global materials company and manufacturer of plastics, latex binders and synthetic rubber, today reported its third quarter 2018 financial results with net sales of $1,200 million, net income of $75 million, and earnings per diluted share of $1.72. Third quarter Adjusted EBITDA was $143 million and Adjusted EPS was $1.83.
Net sales in the third quarter increased 9% versus prior year due mainly to the pass through of higher styrene and butadiene costs. In addition, higher sales volume in the Performance Plastics, Synthetic Rubber and Feedstocks segments was partially offset by lower sales volume in the Latex Binders and Polystyrene segments. Third quarter net income of $75 million was $42 million higher than prior year. Third quarter Adjusted EBITDA of $143 million was $23 million lower than prior year.Prior year third quarter net income included a pre-tax charge of approximately $66 million related to the Company’s debt refinancing. In addition, the prior year third quarter results included an unfavorable pre-tax net timing impact of $24 million in comparison to an unfavorable impact of $4 million in the current year. Excluding these impacts, the lower year-over-year profitability was due to generally higher raw material costs, a slowdown in the automotive and tire markets, as well as a slowdown in demand across numerous end markets in China. In addition, in Polystyrene, we saw inventory destocking as customers awaited lower styrene prices in the fourth quarter.
Commenting on the Company’s performance, Chris Pappas, Trinseo President and Chief Executive Officer, said, “Our strong profitability in the first half of 2018 was met with challenges in the third quarter due to a variety of market factors that appeared late in the quarter. However, the diversity of our product portfolio assisted us in offsetting some of these challenges. We continue to exhibit strong cash generation and returned $52 million to shareholders via share repurchases and dividends during the quarter, and $144 million so far in 2018.”
Third Quarter Results and Commentary by Business Segment
Third Quarter Cash Generation
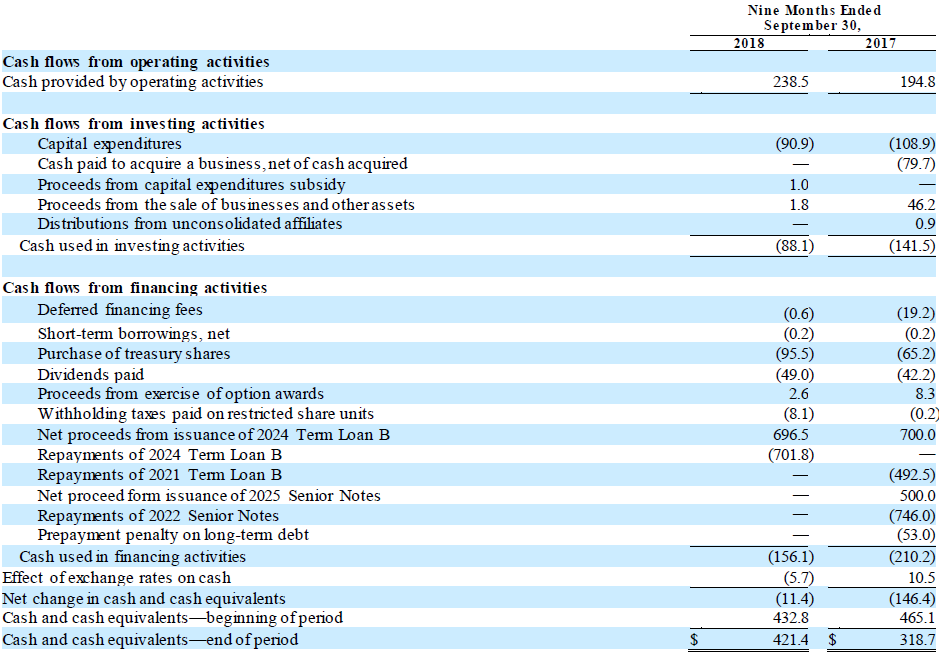
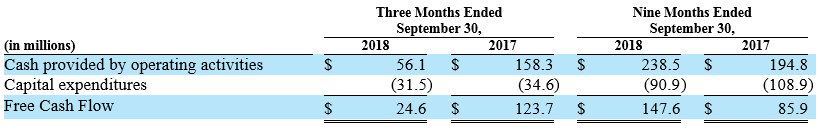
Cash provided by operating activities for the quarter was $56 million and capital expenditures were $31 million, resulting in Free Cash Flow for the quarter of $25 million. Third quarter cash from operations and Free Cash Flow included approximately $41 million of higher working capital. For a reconciliation of Free Cash Flow to cash provided by operating activities, see note 3 below.
2018 and 2019 Outlook
Commenting on the outlooks for the fourth quarter and full year 2018 and full year 2019, Pappas said, “We expect sequentially lower profitability in the fourth quarter due primarily to lower styrene margins. In the short-term, we see a continuation of the market conditions that affected the latter part of the third quarter, but we believe that as we progress into 2019 we will see some return to more normal buying patterns as supply chains begin to normalize, automotive production increases in Europe with more models passing the new WLTP standards and as the impact of China stimulus programs begins to become apparent. Overall, 2019 should be another year of solid earnings and very strong cash generation for Trinseo.”
For a reconciliation of fourth quarter and full year 2018 net income to Adjusted EBITDA and Adjusted EPS, see note 2 below. Additionally, refer to the appendix within Exhibit 99.3 of our Form 8-K, dated November 8, 2018, for further details on how net timing impacts are defined and calculated for our segments.
Conference Call and Webcast Information
Trinseo will host a conference call to discuss its third quarter 2018 financial results on Friday, November 9, 2018 at 10 AM Eastern Time.
Commenting on results will be Chris Pappas, President and Chief Executive Officer, Barry Niziolek, Executive Vice President and Chief Financial Officer, and David Stasse, Vice President, Treasury and Investor Relations. The conference call will be available by phone at:
Participant Toll-Free Dial-In Number: +1 833-241-7248
Participant International Dial-In Number: +1 647-689-4212
Conference ID: 7049968
The Company will also offer a live Webcast of the conference call with question and answer session via the registration page of the Trinseo Investor Relations website.
Trinseo has posted its third quarter 2018 financial results on the Company’s Investor Relations website. The presentation slides will also be made available in the webcast player prior to the conference call. The Company will also furnish copies of the financial results press release and presentation slides to investors by means of a Form 8-K filing with the U.S. Securities and Exchange Commission.
A replay of the conference call and transcript will be archived on the Company’s Investor Relations website shortly following the conference call. The replay will be available until November 9, 2019.
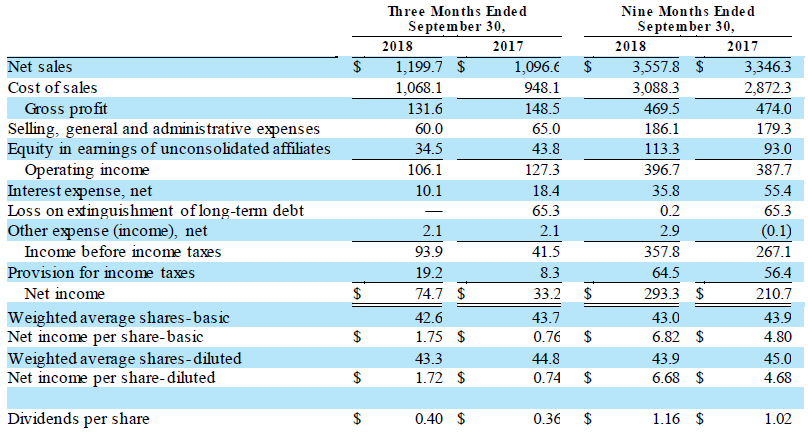
TRINSEO S.A.
Condensed Consolidated Statements of Operations
(In millions, except per share data)
(Unaudited)
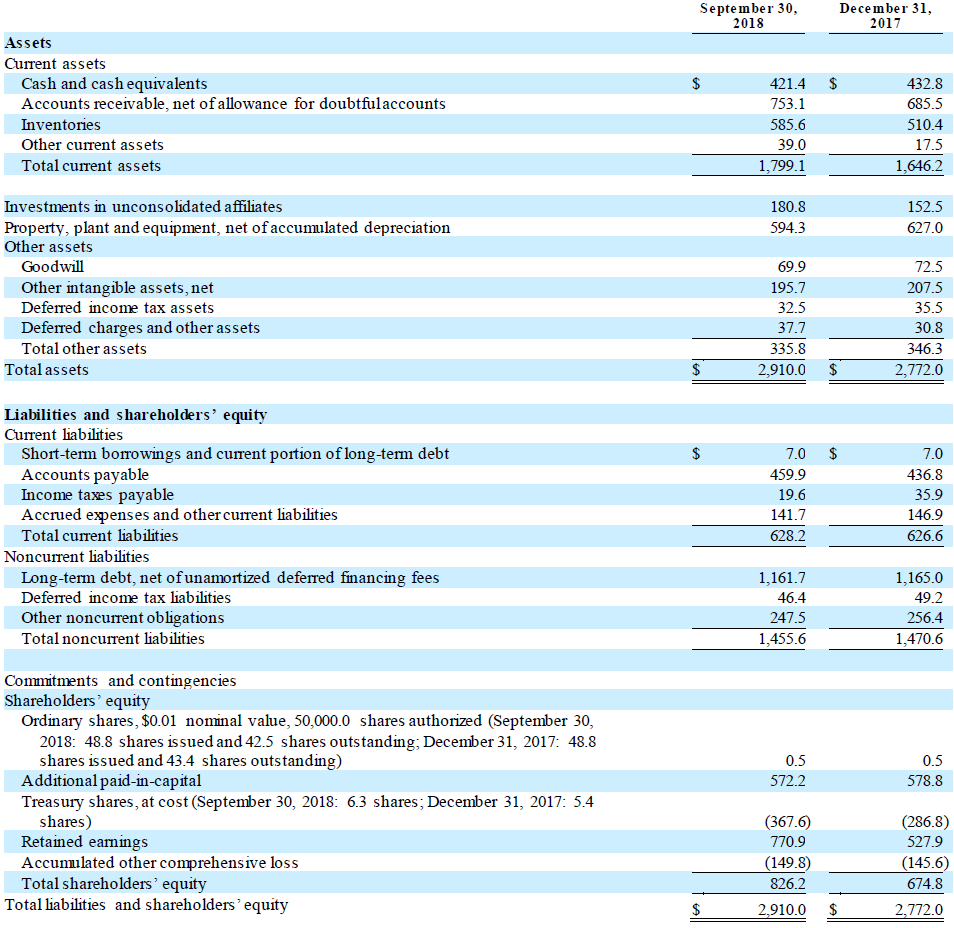
TRINSEO S.A.
Condensed Consolidated Balance Sheets
(In millions, except per share data)
(Unaudited)
TRINSEO S.A.
Condensed Consolidated Statements of Cash Flows
(In millions)
(Unaudited)
TRINSEO S.A.
Notes to Condensed Consolidated Financial Information
(Unaudited)
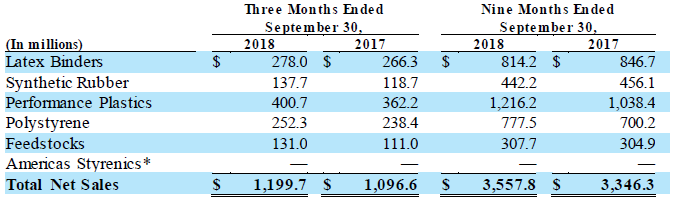
* The results of this segment are comprised entirely of earnings from Americas Styrenics, our 50%-owned equity method investment. As such, we do not separately report net sales of Americas Styrenics within our condensed consolidated statement of operations.
We also present Adjusted EBITDA as a non-GAAP financial performance measure, which we define as income from continuing operations before interest expense, net; income tax provision; depreciation and amortization expense; loss on extinguishment of long-term debt; asset impairment charges; gains or losses on the dispositions of businesses and assets; restructuring charges; acquisition related costs and other items. In doing so, we are providing management, investors, and credit rating agencies with an indicator of our ongoing performance and business trends, removing the impact of transactions and events that we would not consider a part of our core operations.
Lastly, we present Adjusted Net Income and Adjusted EPS as additional performance measures. Adjusted Net Income is calculated as Adjusted EBITDA (defined beginning with net income, above), less interest expense, less the provision for income taxes and depreciation and amortization, tax affected for various discrete items, as appropriate. Adjusted EPS is calculated as Adjusted Net Income per weighted average diluted shares outstanding for a given period. We believe that Adjusted Net Income and Adjusted EPS provide transparent and useful information to management, investors, analysts and other stakeholders in evaluating and assessing our operating results from period-to-period after removing the impact of certain transactions and activities that affect comparability and that are not considered part of our core operations.
There are limitations to using the financial performance measures noted above. These performance measures are not intended to represent net income or other measures of financial performance. As such, they should not be used as alternatives to net income as indicators of operating performance. Other companies in our industry may define these performance measures differently than we do. As a result, it may be difficult to use these or similarly-named financial measures that other companies may use, to compare the performance of those companies to our performance. We compensate for these limitations by providing reconciliations of these performance measures to our net income, which is determined in accordance with GAAP.
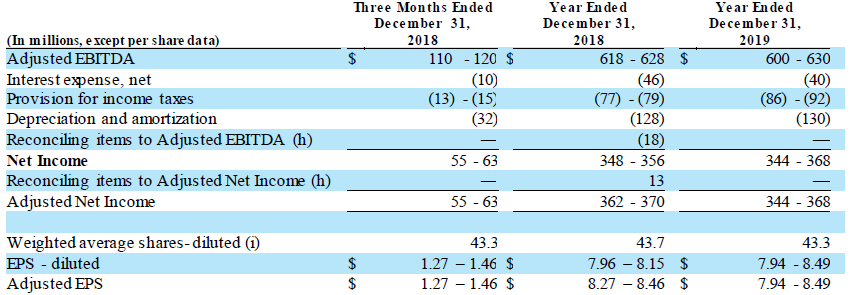
(h) Reconciling items to Adjusted EBITDA and Adjusted Net Income are not typically forecasted by the Company based on their nature as being primarily driven by transactions that are not part of the core operations of the business. As such, for the forecasted three months ended December 31, 2018, full year ended December 31, 2018 and full year ended December 31, 2019, we have not included estimates for these items.
(i) Weighted average shares calculated for the purpose of forecasting Adjusted EPS do not forecast significant future share transactions or events, such as repurchases, significant stock-based compensation award grants, and changes in the Company’s share price. These are all factors which could have a significant impact on the calculation of Adjusted EPS during actual future periods.
The Company uses Free Cash Flow to evaluate and discuss its liquidity position and results. Free Cash Flow is defined as cash from operating activities, less capital expenditures. We believe that Free Cash Flow provides an indicator of the Company’s ongoing ability to generate cash through core operations, as it excludes the cash impacts of various financing transactions as well as cash flows from business combinations that are not considered organic in nature. We also believe that Free Cash Flow provides management and investors with a useful analytical indicator of our ability to service our indebtedness, pay dividends (when declared), and meet our ongoing cash obligations.
Free Cash Flow is not intended to represent cash flows from operations as defined by GAAP, and therefore, should not be used as an alternative for that measure. Other companies in our industry may define Free Cash Flow differently than we do. As a result, it may be difficult to use this or similarly-named financial measures that other companies may use, to compare the liquidity and cash generation of those companies to our own. The Company compensates for these limitations by providing the reconciliation below, which is determined in accordance with GAAP.
Free Cash Flow
Corporate News
Trinseo’s Chuck Fifelski Discusses EIFS & Stucco Applications in Walls & Ceilings Magazine
April 16, 2024
Corporate News
Trinseo Announces Release Date and Conference Call for its First Quarter 2024 Financial Results
April 11, 2024
Corporate News
Trinseo Introduces Groundbreaking Flame-retardant Plastic Grades Without Using PFAS Additives During Manufacturing Process
April 09, 2024