Year Ended 2017 Summary
Fourth Quarter 2017 Summary
*For a reconciliation of EBITDA, Adjusted EBITDA, and Adjusted Net Income to Net Income, as well as a reconciliation of Adjusted EPS, see note 2 below.
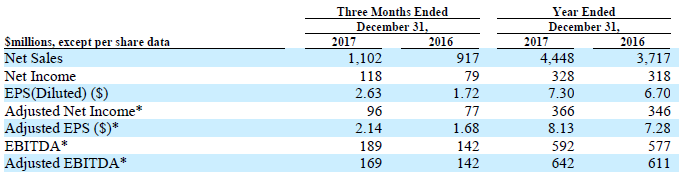
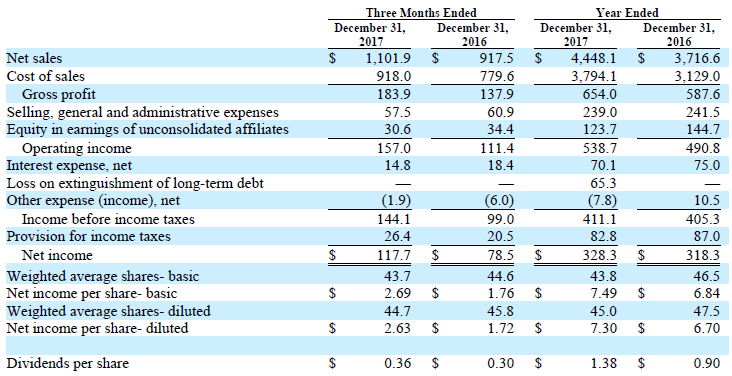
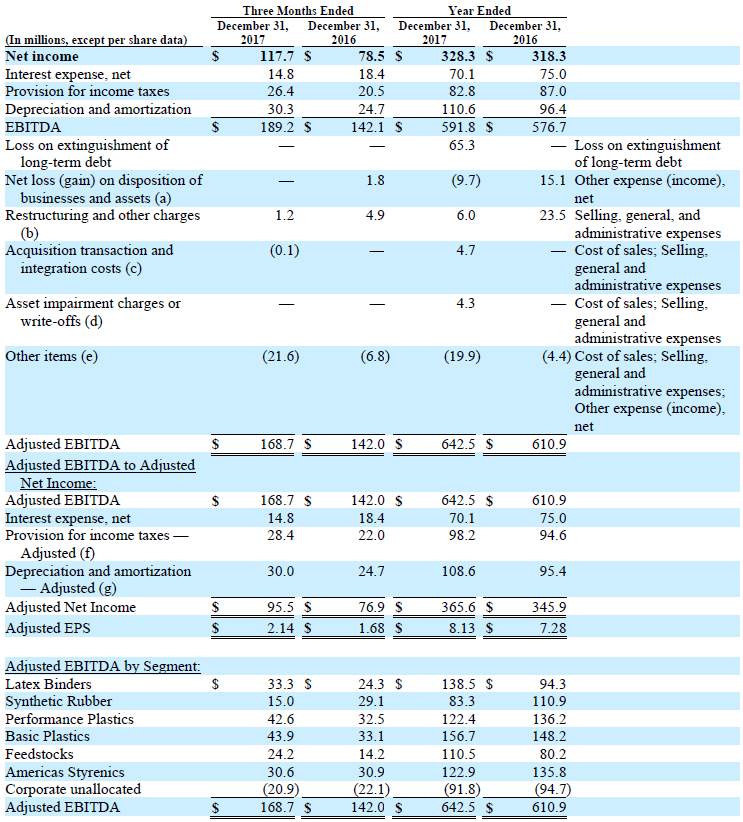
Trinseo (NYSE: TSE), a global materials company and manufacturer of plastics, latex binders and synthetic rubber, today reported its fourth quarter and record full year 2017 financial results with net sales of $1,102 million and $4,448 million, respectively; net income of $118 million and $328 million, respectively; and earnings per diluted share of $2.63 and $7.30, respectively. Fourth quarter and full year Adjusted EBITDA was $169 million and $642 million, respectively, and Adjusted EPS was $2.14 and $8.13, respectively.
Net sales in the fourth quarter increased 20% versus prior year driven primarily by the pass through of higher raw material costs as well as currency. Fourth quarter net income of $118 million, which included a pre-tax gain of approximately $22 million related to changes made to certain Company pension plans, was $39 million higher than prior year. Fourth quarter Adjusted EBITDA of $169 million was $27 million higher than prior year. The higher operational profitability was due primarily to higher styrene, polystyrene, polycarbonate, and Latex Binders margins as well as higher Performance Plastics sales volume. These impacts were partially offset by lower Synthetic Rubber sales volume.
Net sales in the full year increased 20% versus prior year driven primarily by the pass through of higher raw material costs. Full year net income of $328 million was $10 million higher than prior year. This increase was driven by improved performance in the Feedstocks, Basic Plastics, and Latex Binders segments due to higher margin. These improvements were partially offset by lower performance in the Americas Styrenics, Synthetic Rubber, and Performance Plastics segments, in addition to a $65 million pre-tax loss on extinguishment of debt in the current year. Adjusted EBITDA in the full year of $642 million was $31 million higher than prior year which was comprised of about $55 million of fundamental business improvement, partially offset by about $24 million of unfavorable net timing impacts.
Commenting on the Company’s performance, Chris Pappas, Trinseo President and Chief Executive Officer, said, “We continue to be encouraged by our performance. Our fourth quarter results were above the guidance we provided during our third quarter call due to strong operating conditions in several segments as well as pricing initiatives that resulted in higher than expected margins. For the second consecutive year we had record net income and Adjusted EBITDA.”
Pappas continued, “We also had very strong cash generation during the year, and we continue to return cash to shareholders. During 2017 we repurchased approximately 1.4 million shares, utilizing about $89 million of cash, and we increased the dividend by 20%. In total, we returned nearly $150 million to shareholders via these actions. In addition, we completed our first acquisition, API Plastics, and we continue to make excellent progress on our other growth initiatives, including the SSBR expansion and pilot plant in Synthetic Rubber, and the ABS capacity in China, which are now all in operation.”
Fourth Quarter Results and Commentary by Business Segment
Fourth Quarter and Full Year Cash Generation
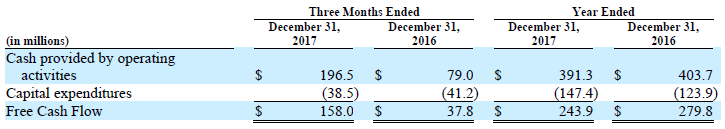
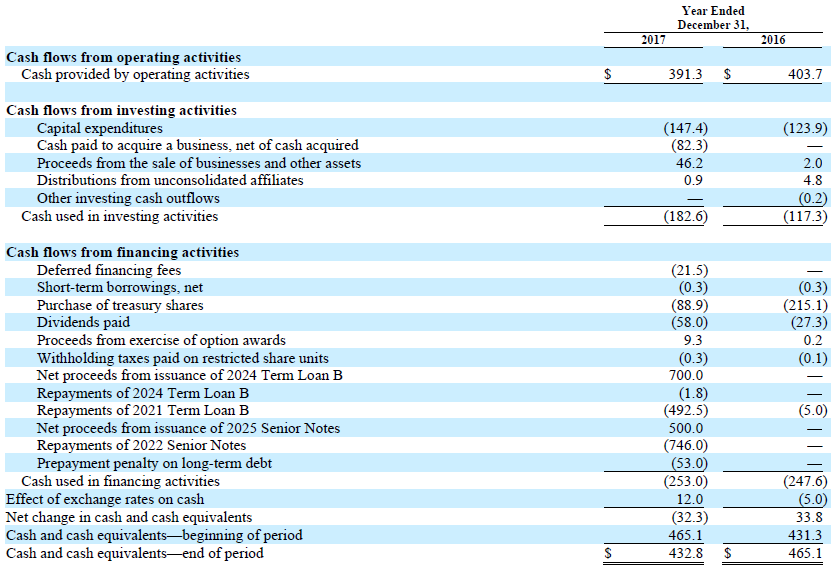
Cash provided by operating activities for the fourth quarter was $196 million and capital expenditures were $38 million, resulting in Free Cash Flow for the quarter of $158 million. Fourth quarter cash from operations and Free Cash Flow included a favorable impact of approximately $34 million from lower working capital. Cash provided by operating activities for the full year was $391 million and capital expenditures were $147 million, resulting in Free Cash Flow for the year of $244 million. Full year cash from operations and Free Cash Flow included an unfavorable impact of approximately $127 million from higher working capital primarily from increasing raw material prices as well as additional working capital requirements from growth initiatives such as the acquisition of API Plastics, and the new SSBR and ABS capacity.
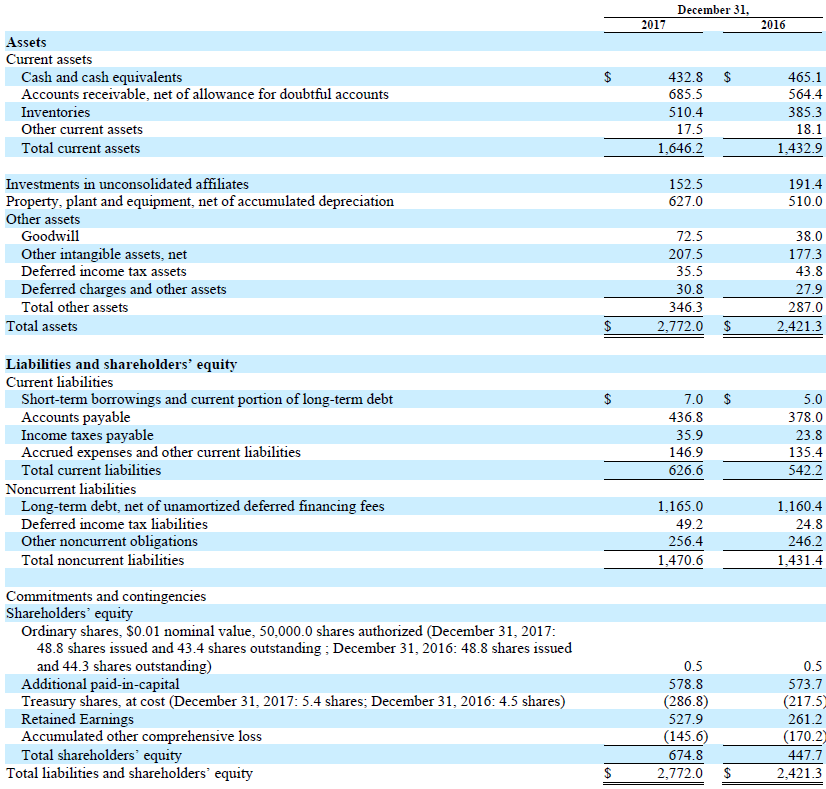
At the end of the year the Company had $433 million of cash reflecting the expenditures of $82 million for the purchase of API Plastics, net of cash acquired, as well as $128 million related to the successful debt refinancing earlier in the year. For a reconciliation of Free Cash Flow to cash provided by operating activities, see note 3 below.
Outlook
The Company is updating previously issued guidance as follows:
Commenting on the outlook for the first quarter and full year 2018 Pappas said, “We expect strong performance in the first quarter from higher styrene margins, including impacts from planned and unplanned styrene production outages, as well as continued, healthy fundamentals across our segments.”
Pappas continued, “Looking ahead to the full year performance, we are increasing our prior 2018 net income and Adjusted EBITDA guidance as we continue to see strong business fundamentals, and as we expect a favorable impact from unplanned styrene outages in the first quarter. In addition, we expect continued strong cash generation for the year. As we move forward, we remain committed to balancing future growth initiatives with returning capital to shareholders. I am very proud of the company’s performance in 2017, and we remain focused on achieving a very strong 2018 and delivering returns to shareholders.&rdquo
For a reconciliation of fourth quarter and full year 2017, as well as first quarter and full year 2018, net income to Adjusted EBITDA and Adjusted EPS, see note 2 below. Additionally, refer to the appendix within Exhibit 99.3 of our Form 8-K, dated February 19, 2018, for further details on how net timing impacts are defined and calculated for our segments.
Conference Call and Webcast Information
Trinseo will host a conference call to discuss its fourth quarter and full year 2017 financial results tomorrow, Tuesday, February 20, 2018 at 10 AM Eastern Time.
Commenting on results will be Chris Pappas, President and Chief Executive Officer, Barry Niziolek, Executive Vice President and Chief Financial Officer, and David Stasse, Vice President, Treasury and Investor Relations. The conference call will be available by phone at:
Participant Toll-Free Dial-In Number: +1 (833) 241-7248
Participant International Dial-In Number: +1 (647) 689-4212
Conference ID / passcode: 5197679
The Company will also offer a live Webcast of the conference call with question and answer session via the registration page of the Trinseo Investor Relations website.
Trinseo has posted its fourth quarter and full year 2017 financial results, including management's commentary, on the Company’s Investor Relations website. The presentation slides will also be made available in the webcast player prior to the conference call. The Company will also furnish copies of the financial results press release and presentation slides to investors by means of a Form 8-K filing with the U.S. Securities and Exchange Commission.
A replay of the conference call and transcript will be archived on the Company’s Investor Relations website shortly following the conference call. The replay will be available until February 20, 2019.
TRINSEO S.A.
Condensed Consolidated Statements of Operations
(In millions, except per share data)
(Unaudited)
TRINSEO S.A.
Condensed Consolidated Balance Sheets
(In millions, except per share data)
(Unaudited)
TRINSEO S.A.
Condensed Consolidated Statements of Cash Flows
(In millions)
(Unaudited)
TRINSEO S.A.
Notes to Condensed Consolidated Financial Information
(Unaudited)
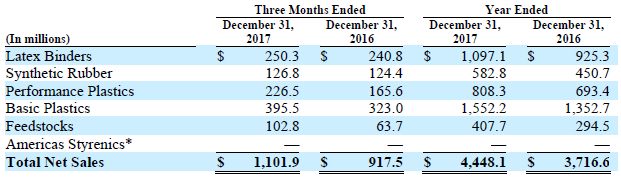
Note 1: Net sales by Segment
Note 2: Reconciliation of Non-GAAP Performance Measures to Net income
EBITDA is a non-GAAP financial performance measure that we refer to in making operating decisions because we believe it provides our management as well as our investors with meaningful information regarding the Company’s operational performance. We believe the use of EBITDA as a metric assists our board of directors, management and investors in comparing our operating performance on a consistent basis.
We also present Adjusted EBITDA as a non-GAAP financial performance measure, which we define as income from continuing operations before interest expense, net; income tax provision; depreciation and amortization expense; loss on extinguishment of long-term debt; asset impairment charges; gains or losses on the dispositions of businesses and assets; restructuring; acquisition related costs and other items. In doing so, we are providing management, investors, and credit rating agencies with an indicator of our ongoing performance and business trends, removing the impact of transactions and events that we would not consider a part of our core operations.
Lastly, we present Adjusted Net Income and Adjusted EPS as additional performance measures. Adjusted Net Income is calculated as Adjusted EBITDA (defined beginning with net income, above), less interest expense, less the provision for income taxes and depreciation and amortization, tax affected for various discrete items, as appropriate. Adjusted EPS is calculated as Adjusted Net Income per weighted average diluted shares outstanding for a given period. We believe that Adjusted Net Income and Adjusted EPS provide transparent and useful information to management, investors, analysts and other stakeholders in evaluating and assessing our operating results from period-to-period after removing the impact of certain transactions and activities that affect comparability and that are not considered part of our core operations.
There are limitations to using the financial performance measures noted above. These performance measures are not intended to represent net income or other measures of financial performance. As such, they should not be used as alternatives to net income as indicators of operating performance. Other companies in our industry may define these performance measures differently than we do. As a result, it may be difficult to use these or similarly-named financial measures that other companies may use, to compare the performance of those companies to our performance. We compensate for these limitations by providing reconciliations of these performance measures to our net income, which is determined in accordance with GAAP.
(a) Net gain on disposition of businesses and assets during the year ended December 31, 2017 relates primarily to the sale of our 50% share in Sumika Styron Polycarbonate to Sumitomo Chemical Company Limited. Net loss on disposition of businesses and assets during the year ended December 31, 2016 presented above relates to impairment charges recorded for the loss on sale of the Company’s primary operating entity in Brazil, which included both latex binders and automotive businesses.
(b) Restructuring and other charges for the 2017 periods presented above primarily relate to employee termination benefit and decommissioning charges incurred in connection with the decision to cease manufacturing activities at our latex binders manufacturing facility in Livorno, Italy, as well as employee termination benefit charges related to the upgrade and replacement of the Company’s compounding facility in Terneuzen, The Netherlands. Restructuring and other charges for the 2016 periods presented above primarily relate to approximately $20.0 million in charges incurred during the year ended December 31, 2016 in connection with the Livorno, Italy action discussed above, approximately $3.9 million of which was incurred during the three months ended December 31, 2016. The remaining restructuring charges for 2016 relate to the Company’s decision to divest our operations in Brazil as well as the closure of our Allyn’s Point latex binders manufacturing facility.
Note that the accelerated depreciation charges incurred as part of both the upgrade and replacement of the Company’s compounding facility in Terneuzen, The Netherlands as well as the closure of our Allyn’s Point facility are included within the “Depreciation and amortization” caption above, and therefore are not included as a separate adjustment within this caption.
(c) Acquisition transaction and integration costs for the 2017 periods presented above relate to advisory and professional fees incurred in conjunction with the Company’s acquisition of API Plastics, which closed in July 2017. These costs also include a non-cash fair value inventory adjustment recorded in conjunction with this acquisition.
(d) Asset impairment charges or write-offs for the year ended December 31, 2017 relate to the impairment of certain long-lived assets within the Company’s Performance Plastics segment.
(e) Other items for the 2017 periods presented above primarily relate to a curtailment gain recorded as a result of changes to certain of the Company’s pension plans in Europe, offset by fees incurred in conjunction with the Company’s debt refinancing which was completed during the third quarter of 2017. Other items for the year ended December 31, 2016 primarily includes other income of $6.9 million from the effective settlement of certain value-added tax positions, which were recorded during the fourth quarter of 2016, offset by $2.5 million of fees incurred in conjunction with the Company’s secondary offerings completed during the year.
(f) Adjusted to remove the tax impact of loss on extinguishment of long term debt and the items noted in (a), (b), (c), (d), (e) and (g). For the full year and fourth quarter, the income tax expense (benefit) related to these items was determined utilizing the applicable rates in the taxing jurisdictions in which these adjustments occurred.
The three months and year ended December 31, 2017 exclude net benefits of $9.7 million and $0.8 million related to adjustments in reserves for uncertain tax positions and provision to return adjustments, respectively, partially offset by the exclusion of net detriments of $3.0 million related to jurisdictional tax rate changes, including the impact of U.S. tax reform. The three months and year ended December 31, 2016 exclude a net benefit of $0.6 million and $0.9 million, respectively, related to adjustments in reserves for uncertain tax positions. The three months and year ended December 31, 2016 also excluded $0.5 million and $1.6 million, respectively, in benefits recognized related to provision to return adjustments.
(g) For the full year ended December 31, 2017, the amount excludes accelerated depreciation of $2.0 million related to the upgrade and replacement of the Company’s compounding facility in Terneuzen, The Netherlands. For the full year ended December 31, 2016, the amount excludes accelerated depreciation of $0.5 million related to the closure of our Allyn’s Point facility.
For the same reasons discussed above, we are providing the following reconciliation of forecasted net income to forecasted Adjusted EBITDA and Adjusted EPS for the three months ended March 31, 2018, as well as for the full year ended December 31, 2018. See “Note on forward-looking statements” above for a discussion of the limitations of these forecasts.
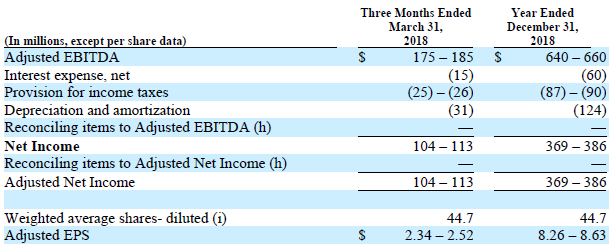
(h) Reconciling items to Adjusted EBITDA and Adjusted Net Income are not typically forecasted by the Company based on their nature as being primarily driven by transactions that are not part of the core operations of the business. As such, for the forecasted three months ended March 31, 2018 and full year ended December 31, 2018, we have not included estimates for these items.
(i) Weighted average shares calculated for the purpose of forecasting Adjusted EPS do not forecast significant future share transactions or events, such as repurchases, significant stock-based compensation award grants, and changes in the Company’s share price. These are all factors which could have a significant impact on the calculation of Adjusted EPS during actual future periods.
Note 3: Reconciliation of Non-GAAP Liquidity Measures to Cash from Operations
The Company uses Free Cash Flow to evaluate and discuss its liquidity position and results. Free Cash Flow is defined as cash from operating activities, less capital expenditures. We believe that Free Cash Flow provides an indicator of the Company’s ongoing ability to generate cash through core operations, as it excludes the cash impacts of various financing transactions as well as cash flows from business combinations that are not considered organic in nature. We also believe that Free Cash Flow provides management and investors with a useful analytical indicator of our ability to service our indebtedness, pay dividends (when declared), and meet our ongoing cash obligations.
Free Cash Flow is not intended to represent cash flows from operations as defined by GAAP, and therefore, should not be used as an alternative for that measure. Other companies in our industry may define Free Cash Flow differently than we do. As a result, it may be difficult to use this or similarly-named financial measures that other companies may use, to compare the liquidity and cash generation of those companies to our own. The Company compensates for these limitations by providing the reconciliation below, which is determined in accordance with GAAP.
Free Cash Flow